Metrics
As already mentioned, every Typesense node is deployed as a Kubernetes Pod and includes three containers:
- Typesense server – the actual Typesense node.
- Metrics exporter – a sidecar based on typesense-prometheus-exporter that exposes Prometheus-style metrics for each node via a
PodMonitorresource. - Cluster healthcheck – a sidecar based on typesense-healthcheck that aggregates the health of all nodes, offering a REST/JSON endpoint and a built-in web UI to monitor cluster and node status in real time.
The typesense-prometheus-exporter sidecar is a lightweight Prometheus exporter designed to expose metrics from a Typesense cluster for monitoring and alerting purposes. The exporter collects metrics from the Typesense /metrics.json and /stats.json endpoints and presents them in a Prometheus-compatible format.
The operator automatically deploys a PodMonitor into your cluster, so Prometheus will discover and scrape the sidecar’s /metrics endpoint without any additional configuration:
apiVersion: monitoring.coreos.com/v1
kind: PodMonitor
metadata:
  name: ts-podmonitor
  namespace: default
  labels:
    release: { RELEASE_NAME }
spec:
  selector:
    matchLabels:
      { LABEL_OF_THE_STATEFULSET_PODS }
  namespaceSelector:
    matchNames:
      - default
  endpoints:
    - port: metrics
      path: /metrics
      interval: 15s
      scheme: http
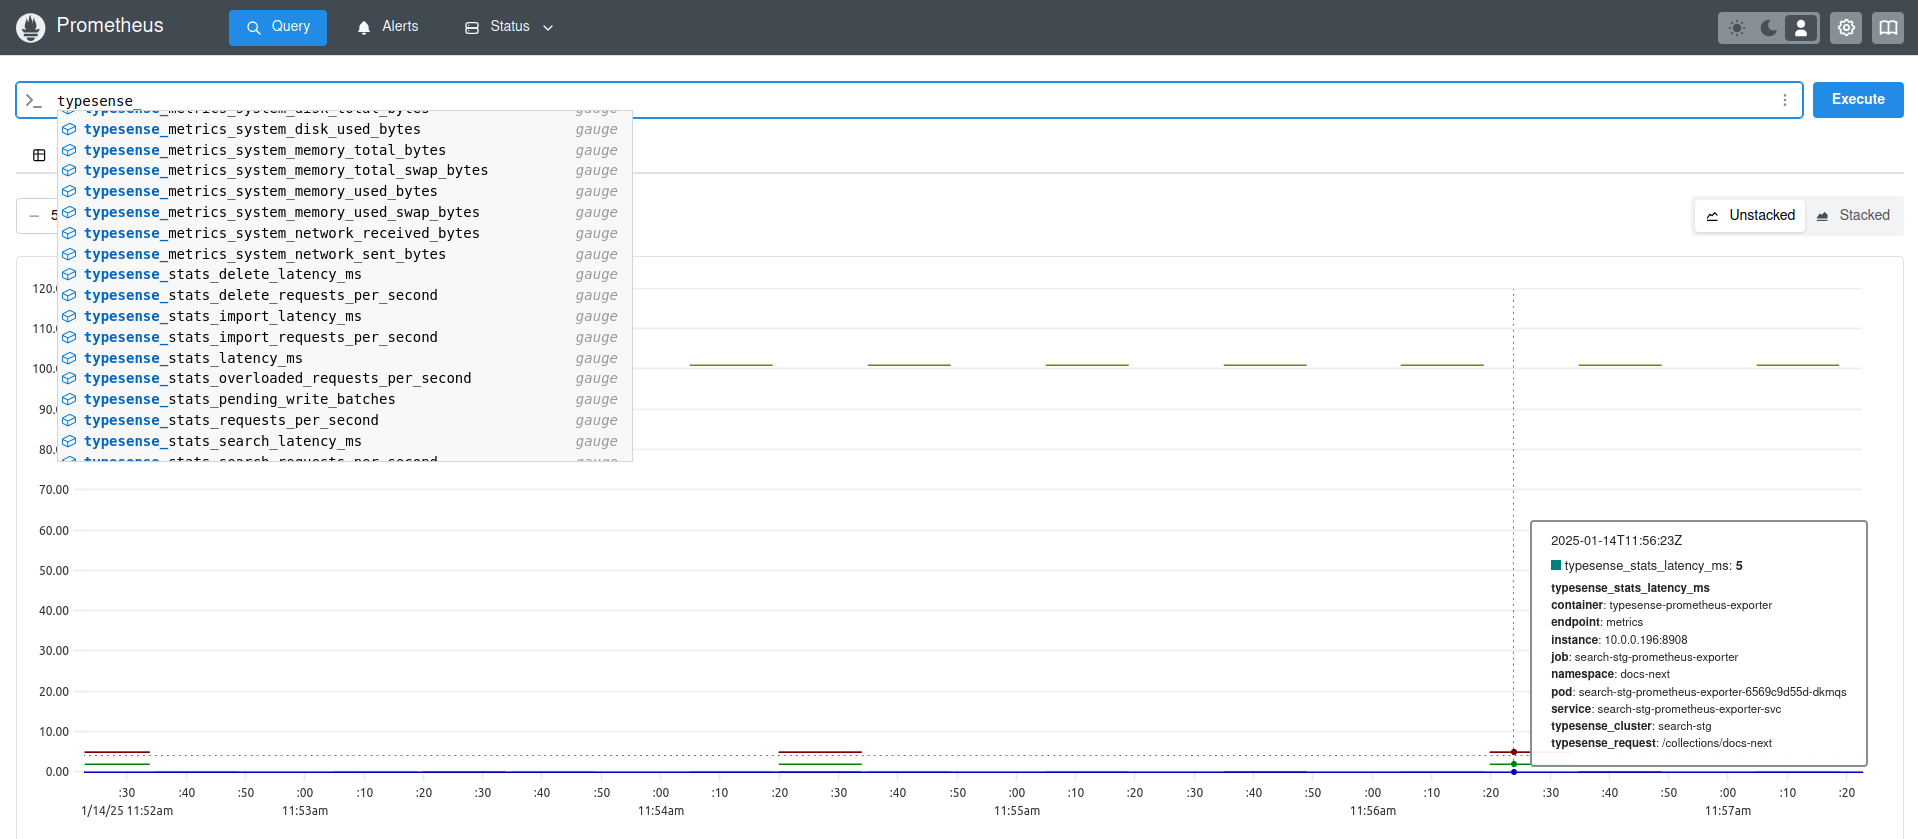
Exposed Metrics
The exporter gathers various metrics from the Typesense /metrics.json endpoint, including:
- CPU Utilization: Per-core and overall CPU usage percentages.
- Memory Usage: Active, allocated, and retained memory statistics.
- Disk Usage: Total and used disk space.
- Network Activity: Total bytes sent and received.
- Typesense-specific Metrics: Fragmentation ratios, mapped memory, and more.
note
- Each metric is labeled with
typesense_clusteras the name of the Typesense cluster you want to fetch metrics from. - Each stat is labeled with
typesense_clusteras the name of the Typesense cluster you want to fetch stats from, and additionally withtypesense_requestfor any metrics reporting back on individual requests. - All FQDNs for Prometheus Descriptors collected from metrics are prefixed with
typesense_metrics_. - All FQDNs for Prometheus Descriptors collected from
statsare prefixed withtypesense_stats_.
Configuration
| Variable | Type | Default | Required | Description |
|---|---|---|---|---|
| LOG_LEVEL | int | 0 | Log level | |
| TYPESENSE_API_KEY | string | — | 🔴 | API key for accessing each Typesense node |
| TYPESENSE_HOST | string | — | 🔴 | Hostname or FQDN of the Typesense node |
| TYPESENSE_PORT | uint | 8108 | Port for Typesense REST/API Port | |
| TYPESENSE_PROTOCOL | string | http | Protocol for Typesense API (http or https) | |
| TYPESENSE_CLUSTER | string | — | 🔴 | Cluster identifier label for metrics |
| METRICS_PORT | uint | 8908 | Port on which /metrics is served |
note
All these values are automatically configured by the operator.